


With each trial having two possible outcomes (success or failure) and a constant chance of success (p), a binomial distribution table aids in determining the likelihood of reaching a given number of successes in a predetermined number of independent trials. Probabilities for different values of n (number of trials), x (successes), and p are arranged in the table. To utilize it, find n, then x in the row and p in the column. The table’s value yields 𝑃 (𝑋 = 𝑥) P(X=x). It makes complicated binomial probability computations easier.
Table of Contents
What is a binomial distribution?
Understanding what a binomial distribution is is crucial before delving into the table itself. Fundamentally, the likelihood of attaining a particular number of “successes” in a predetermined number of separate experiments is represented by a binomial distribution. These experiments’ main characteristic is that there are only two conceivable outcomes: success or failure.
Consider tossing a coin 10 times, for instance. The outcome of each flip can be either heads or tails. The binomial distribution would assist you in determining the likelihood of receiving precisely six heads.
Why Use a Binomial Distribution Table?
You may be wondering why a table is required now that you understand what a binomial distribution is. Every time, couldn’t we just do the math? Yes, in theory, but it’s not always practical to carry out intricate computations each time you need to determine the likelihood of an occurrence. The binomial distribution table is useful in this situation.
By providing you with pre-calculated probability for various circumstances, a binomial distribution table streamlines the procedure. Instead of calculating the likelihood from start, you can simply search it up with only a few essential bits of information.
Breaking Down the Table
Although it may appear daunting at first, the binomial distribution table is really helpful if you know how it operates. Three primary variables form the framework of the table:
n is the number of trials or experiments, and p is the likelihood that a single trial would be successful.
x: The quantity of accomplishments you’re hoping for
Usually, each table has rows for x (the number of successes) and columns for different values of p (the chance of success). The associated probabilities for various combinations of n, p, and x are contained in the table.
How to Read the Table
It’s similar to following a basic recipe to read a binomial distribution table. Let’s dissect it in detail:
Determine your variables: You must be aware of the number of trials you are doing (n), the likelihood that each trial will be successful (p), and the number of successes you hope to achieve (x).
Find the row containing n: Locate the matching row in the table when you know how many trials there are.
Locate the appropriate column: Find the column that corresponds to the success probability, p, by moving across the row.
Obtain your outcome: The likelihood of getting precisely x successes is the number where the row and column cross.
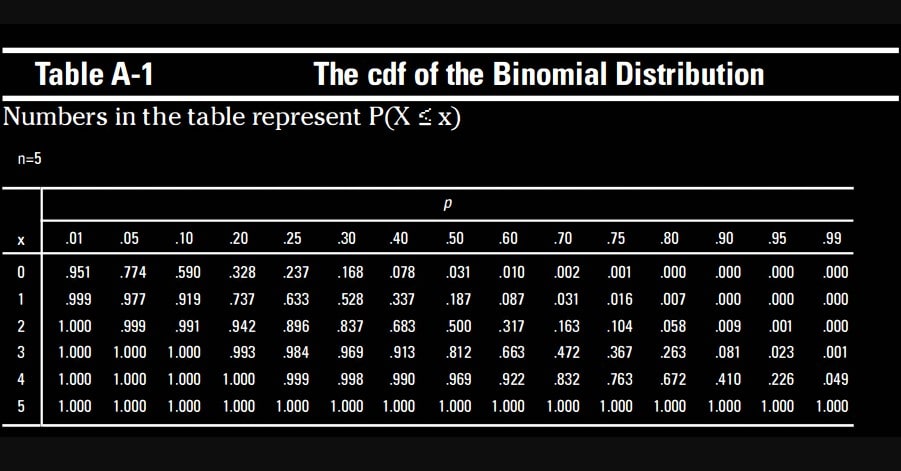
For instance, you can easily check the table to get the likelihood of receiving precisely three heads (x = 3) when the probability of success (heads) is 0.5 (p = 0.5) while you are flipping a coin five times (n = 5).
Real-Life Applications of the Binomial Distribution Table
This table is employed in more real-world contexts than you may believe, despite your first assumption that it is only a classroom tool. It is used by researchers, businesses, and even athletes to forecast results and make choices. Let’s look at some real-world instances.
Business Decision-Making
Businesses frequently use a predetermined number of clients in their marketing initiatives. They are aware of the proportion of clients who usually react favorably based on historical data. They can forecast the number of clients who will likely react to the next campaign by using the binomial distribution table.
Medical Studies
Binomial distributions are often used by medical researchers to assess the efficacy of therapies. For example, the binomial distribution table may be used to forecast how many patients would benefit from a treatment with a 70% success rate in a research of 100 patients.
Sports and Games
Binomial distributions are even used by sportsmen without their knowledge! Imagine a sequence of free throws being made by basketball players. Using the binomial distribution table, coaches may forecast a player’s chances of making a specific amount of shots based on their prior performance.
The Math Behind the Table
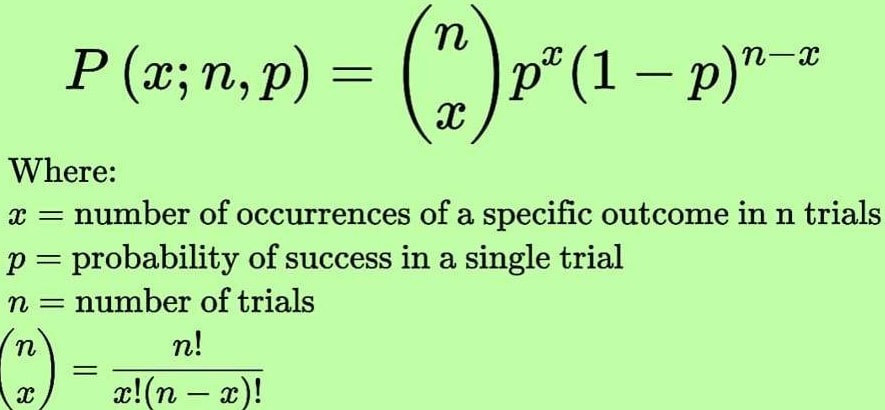
Even if the table offers easily accessible probabilities, it’s still beneficial to comprehend the underlying mathematics, even if you are not required to perform the calculations yourself. The formula for binomial probability is:(nx)⋅px⋅(1−p)n−x = P(x)\binom{n}{x} \cdot p^x \cdot (1 – p)^{n – x} = P(x)(xn)⋅px⋅(1−p)n−x = P(x)
Where:
The binomial coefficient, (nx)\binom{n}{x}(xn), determines the number of ways in which x successes may be obtained in n trials.
The probability of success raised to the power of the number of successes is denoted by pxp^xpx.
(1-p)n−x(1 – p)^{n – x}(1−p)n−x is the reason for the failures in the other trials.
Although this method may appear complicated, the table saves you from having to do each step by hand.
Common Pitfalls to Avoid
While using a binomial distribution table is straightforward, there are a few common mistakes that people often make.
Not Knowing the Exact Values for p and n
The table is based on a defined number of trials (n) and certain success probability (p). The table will not provide you with an accurate answer if you do not have the precise data. Before you start looking at the table, make sure you understand these figures.
Confusing Success and Failure
It might be simple to mix up what constitutes a success and what does not. For instance, is success in medical research determined by whether a treatment is successful or unsuccessful? Always be explicit about your scenario’s definition of success.
Going Beyond the Table
Despite being an excellent tool, the binomial distribution table has drawbacks. For example, tables are usually only available for specific n and p ranges. You may need to use calculators or statistical software in place of a table if your issue includes really huge numbers.
Furthermore, the binomial distribution may begin to resemble other distributions, such as the Poisson or normal distribution, in situations when the likelihood of success is extremely low or extremely high. You may require a more sophisticated strategy in certain situations.
Conclusion:
The binomial distribution table may streamline your computations and offer instant insights into the likelihood of different events, whether you’re performing scientific study, managing a business, or flipping coins. It is a useful tool for making decisions in the real world, not simply for math. You will be better prepared to manage any circumstance involving probability if you know how to read and apply the table. This will make you a more knowledgeable and capable decision-maker.
Therefore, use a binomial distribution table the next time you are unsure about the probability of a specific event. It may include the solutions you require.